
Capital Turnover Ratio: Formula, Example, and Smart Insights
A simple guide to calculating capital turnover ratio, interpreting the results, and using it to maximize capital and profits.

Anjali Singh
Assistant Manager
Published Date:Jan 21, 2026

A simple guide to calculating capital turnover ratio, interpreting the results, and using it to maximize capital and profits.
Anjali Singh
Assistant Manager

Assistant Manager

Hey there, I'm Anjali Singh. With over 6 years of experience in finance, I specialize in creating content on banking, loans, and financial planning. My goal is to simplify complex financial topics and help readers make informed decisions through my articles.

Others · Jul 10, 2026
CIBIL score updates every 30–45 days. Know when lenders report, why your score hasn't changed yet, and how to track updates faster. Check your free credit score on My Mudra.
Others · Jul 10, 2026
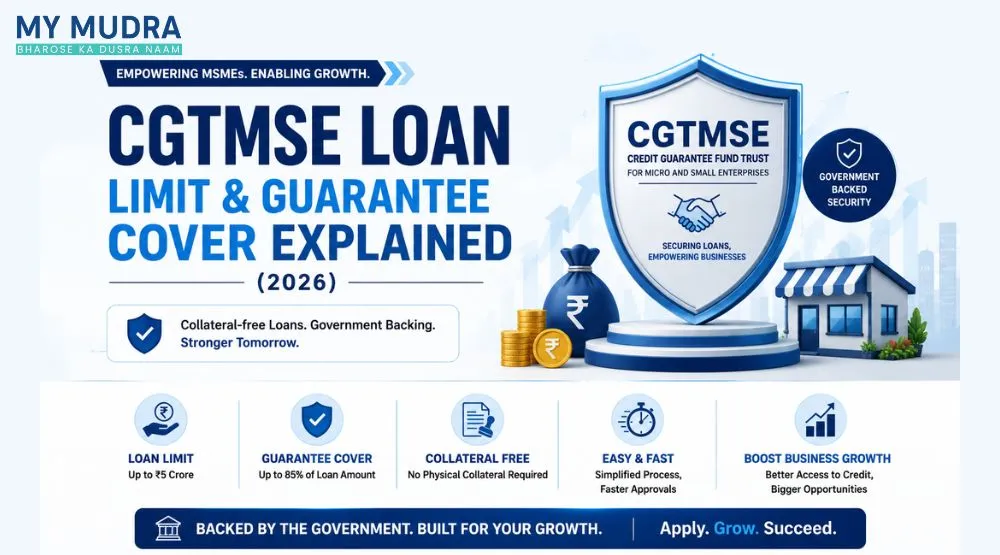
Wondering how much loan you can get under the CGTMSE scheme? This guide explains the latest CGTMSE loan limit, guarantee cover, coverage percentage, eligibility, and benefits to help MSMEs and entrepreneurs secure collateral-free business financing in 2026.
Others · Jul 6, 2026
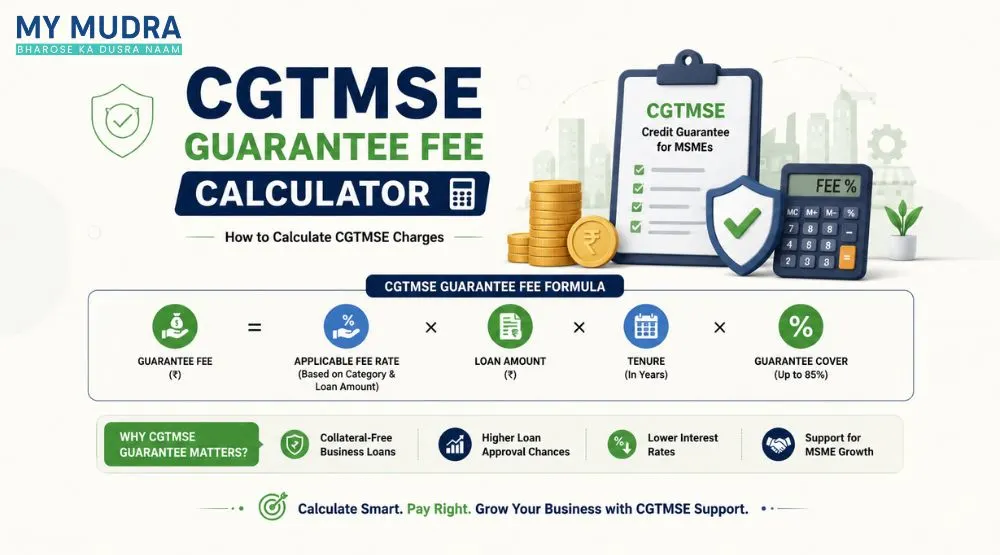
Wondering how CGTMSE guarantee charges are calculated? Learn the fee calculation formula, applicable rates, guarantee cover, and factors affecting CGTMSE charges for MSME loans.